

TARIO-2: A Whole-Transcriptome Foundation Model from H&E Alone
Spatial transcriptomics may be the richest measurement of a tumor we have. It's also almost never collected. Here's how we get around that.

tldr: At Noetik, we build foundation models of patient biology. Accordingly, we generate data best suited for molecularly characterizing patient tissue to train these models. However, the specific modality of data we believe is the richest—18,963-plex spatial transcriptomics (SpT)—is a research assay not used in clinical practice. To help ensure our models can be deployed more universally, we’ve created an evolution of a prior model called ‘TARIO-2’. TARIO-2 has been trained on rich multimodal data on thousands of patients, and acts as a translation layer between routinely-collected tumor data (H&E) and SpT. In this piece, we report early accuracy metrics, how we interpret the results, and what models like it may mean for the future of increasingly personalized cancer care. Finally: TARIO-2’s performance in distinguishing responders from non-responders in a novel treatment regimen setting has been accepted to a major upcoming conference, and we look forward to sharing more details of this work closer to that presentation.
An interactive demo of TARIO-2 predictions on real cancer WSI’s can be found here.
To discuss partnerships over this model, reach out to partnerships@noetik.ai.
Introduction
At Noetik, we build foundation models of human biology. In other words, our models attempt to understand the full complexity of a patient’s tissue well enough to predict which drugs will work and why. Our earlier models, trained on 18,963-plex spatial transcriptomics (SpT) data collected at subcellular resolution, have demonstrated that this kind of understanding is achievable, given sufficiently rich measurements. But richness and availability of human biological data are always in tension. SpT is extremely expensive to generate, rarely collected outside academic settings, and never used in clinical practice. If our models can only interpret patients whose tissue has been profiled with SpT, then they can only interpret a vanishingly small fraction of cancer patients, and they definitely can’t do it in the clinic.
H&E pathology images sit at the other end of this tradeoff. They are inexpensive, routinely collected, and, most critically, already exist for nearly every cancer patient. At first glance, they reveal dramatically less than a spatial gene map. But H&E contains far more than meets the human eye. Spatial and morphological patterns in tumor and adjacent cells and tissues can be strongly correlated with gene expression: some cases are obvious, like genes expressed in easily identified cell types, while others are not salient to the human eye but predictive nonetheless.
TARIO-2 is a new foundation model we have built to exploit exactly this fact. It extends the TARIO architecture, which we previously developed for SpT data, to multimodal sequences of H&E and SpT tokens. Critically, at inference time TARIO-2 requires only an H&E image as input1. From this image alone, TARIO-2 generates a predicted expression map for every gene in its training panel, effectively embedding that patient into the same rich biological representation our SpT-trained models operate in, at the cost of GPU-minutes.
As a result, TARIO-2 has allowed us to dramatically expand our partnership base for clinical trials, as the barrier to entry is not “enough physical tumor tissue to extract SpT data from“, but simply “do you have H&E images?“ Nearly every pharma company, every clinical trial, and every hospital biobank can answer yes to that question.
In a forthcoming piece, we will show how we are applying TARIO-2 to H&E tumor images in the context of clinical trials. In that use case, the pretrained TARIO-2 can learn from existing therapeutic outcomes data and, consequently, drive the design of upcoming clinical trials.
But even before response prediction enters the picture, the ability to embed any clinical H&E into a shared, high-dimensional representation of patient biology is immediately and independently valuable. This essay discusses this particular use-case of TARIO-2, how accurate it is, and what its predictions reveal about the relationship between tissue morphology and the transcriptome. Moreover, while this essay discusses one way of using this model, we view TARIO-2 as a more general simulator of cancer biology, which supports a wide variety of use cases.
If you are interested in partnering on any of these models, please reach out to partnerships@noetik.ai.
How accurate is it?
Generally speaking: accurate for thousands of genes across various cancer types, with the accuracy slowly diminishing for genes with more spatially diffuse expression patterns (which are intrinsically harder to learn).
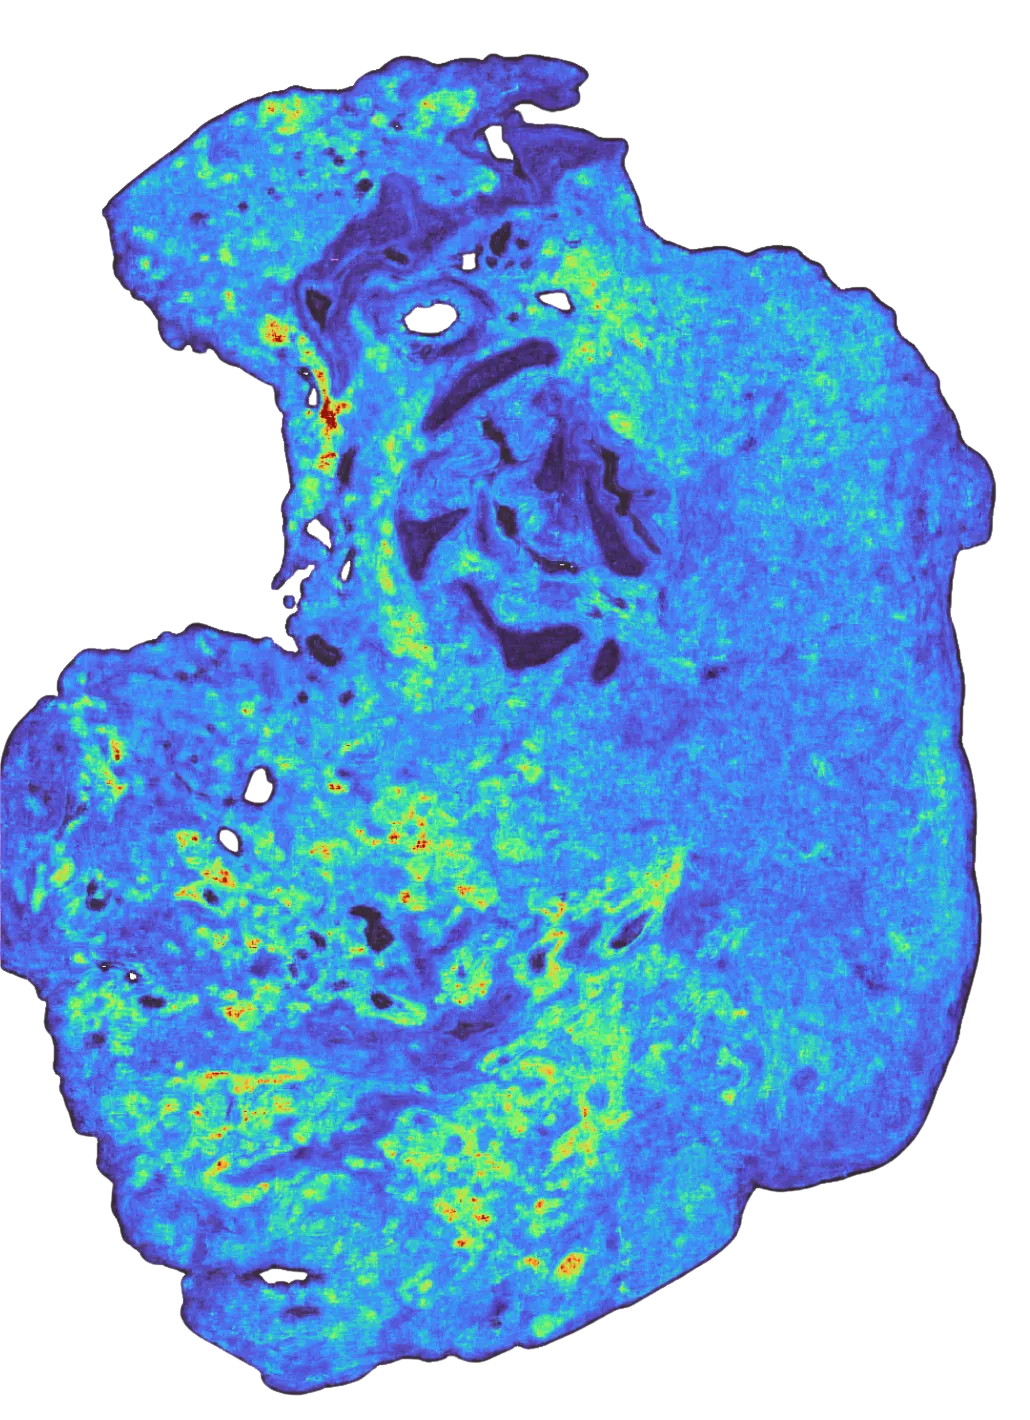
First, some context. TARIO-2 treats SpT data like images aligned to corresponding H&E images. Except instead of being 3-channel RGB images like H&E, the SpT data contain roughly 20,000 “colors”; one for each gene in the whole-transcriptome panel TARIO-2 is trained on. These visuo-transcriptomic data are generated at submicron (and therefore subcellular) resolution, but at inference time we typically make H&E-to-SpT predictions at a much coarser grid, trading spatial fidelity for inference speed. This is merely a compute limitation, though: the more GPUs we throw at the problem, the higher resolution the predictions (hinting at an additional “scaling axis” described below.)
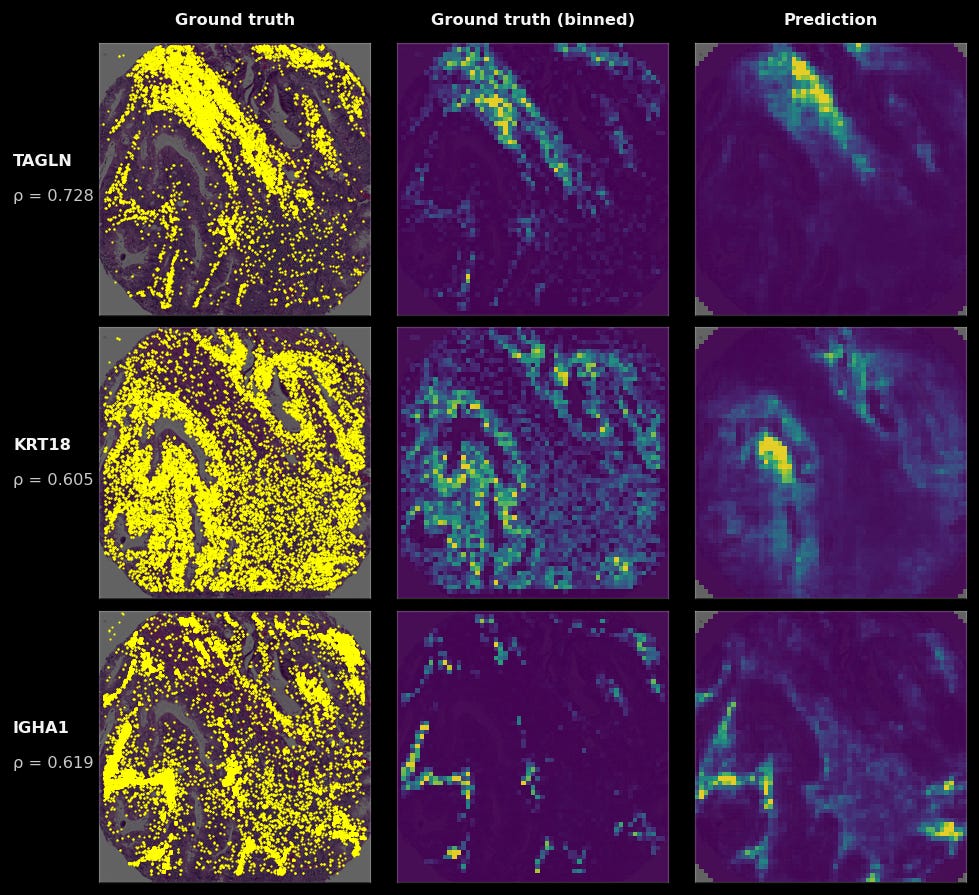
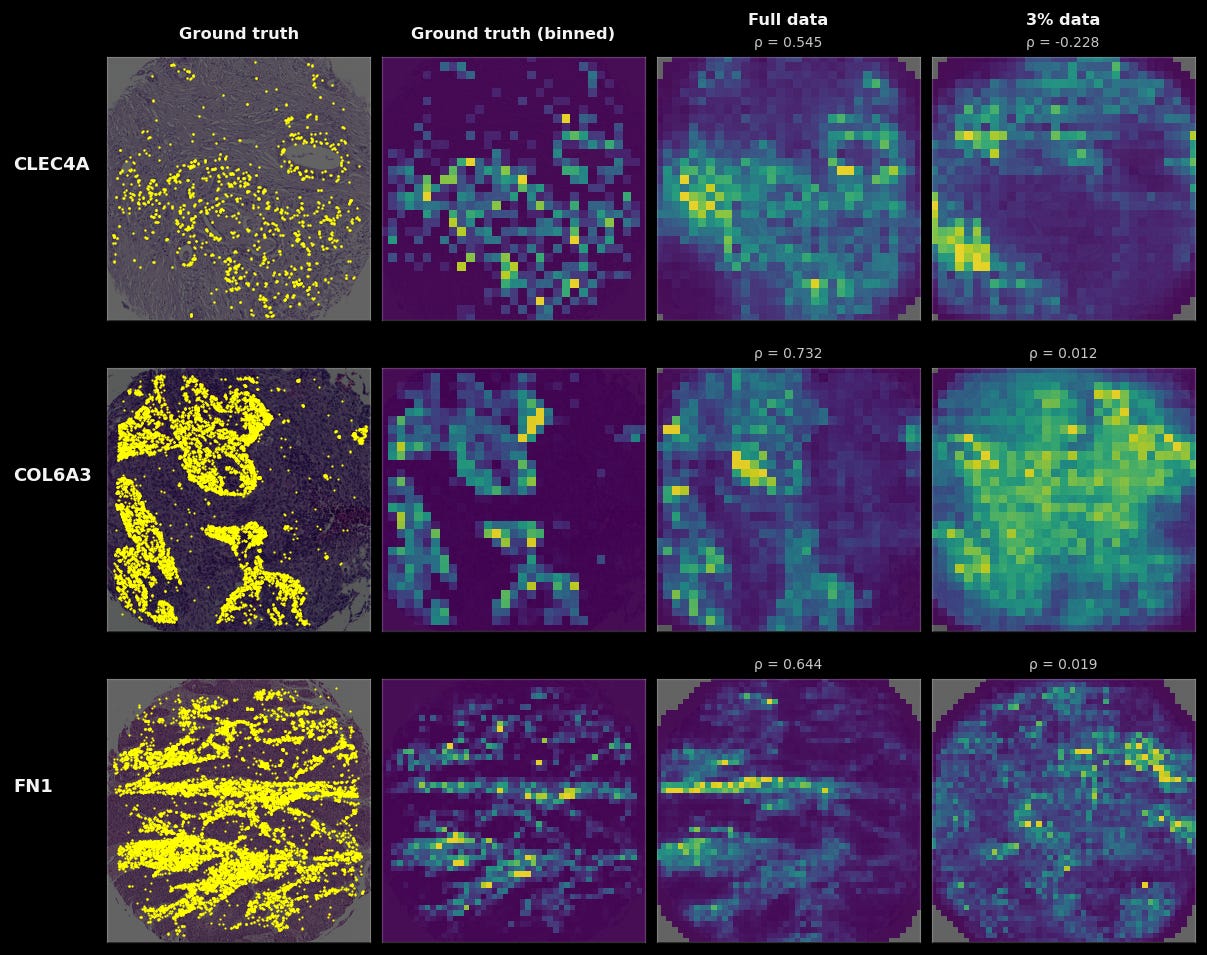
To give a visualization on what model predictions look like: on the left, we see the raw RNA abundance of this gene in a single tumor sample (in yellow), in the middle, the binned values of those ground-truth transcripts, and on the right, the model’s predictions (yellow is high, purple is low) when given only the H&E of that sample. You can see that while the grids are larger than any individual cell, in aggregate, the general spatial pattern they make up closely matches the ground truth.
We can quantify the accuracy of TARIO-2 by binning the ground truth transcripts into the same grid-like format as TARIO-2’s outputs and computing the spatial correlation coefficient for each gene across every tumor sample. The higher the correlation, the better the model’s prediction. But while this is a correct estimation of raw accuracy, it is an underestimation of where the model is most useful. Not all genes display interesting spatial patterns worth predicting. Some are housekeeping genes expressed uniformly; others are expressed or detected at levels too low to form any predictable spatial structure.
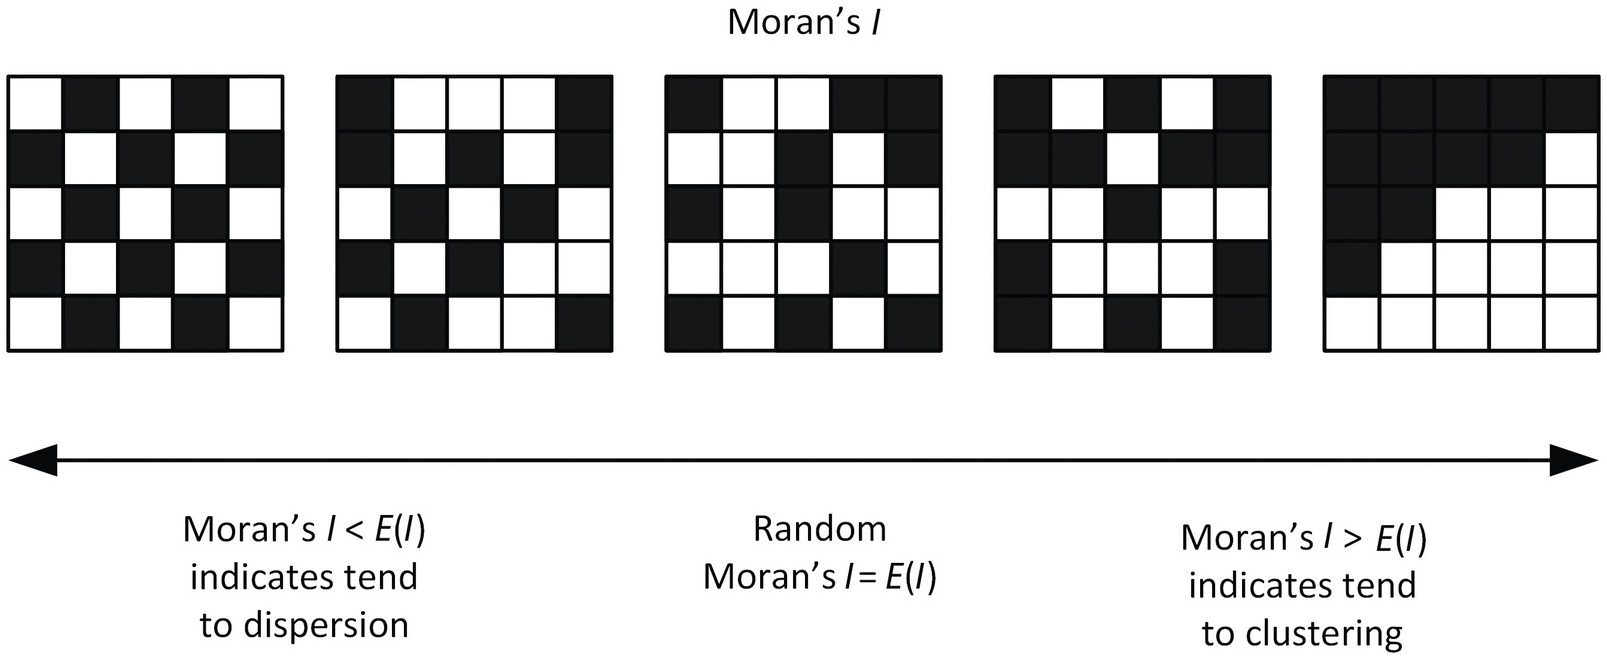
To separate the genes that do have recoverable spatial signals from those that don’t, we need a measure of how concentrated a gene’s expression is across space, averaged over many tissue samples. We use a metric called Moran’s I for this; genes with a higher Moran’s I have more spatial signal, and thus the model’s performance of those genes matter more.
With that technical context, we can finally present TARIO-2 accuracy, on patients held out of training and categorized by cancer subtype. TARIO-2 is trained on 2,545 patients and validated on a held-out set of 213, with no patient overlap between the two. Note that because we generate data from many large, spatially distinct regions of each patient tissue sample, the actual number of multimodal tissue “images” we train and validate on is orders of magnitude larger.
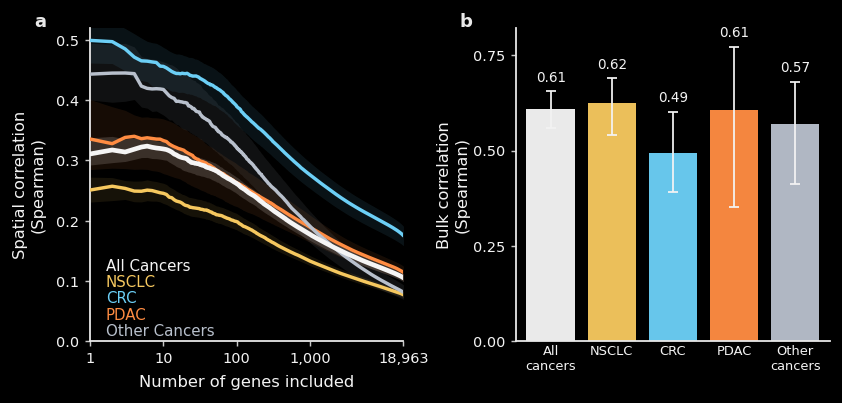
The left plot shows spatial correlation as a function of how many genes are included, ranked from most to least spatially structured. For the highest-signal genes, TARIO-2 achieves spatial correlations around 0.3–0.5, degrading gracefully as noisier genes are included. Performance varies by cancer type, likely reflecting greater morphological heterogeneity in some cancers.
The right plot shows bulk correlation, which collapses each sample into a single expression value per gene and asks how well TARIO-2 recovers overall abundance regardless of spatial arrangement. These correlations are notably higher, around 0.6 across most cohorts, meaning that even when the precise spatial pattern is difficult to recover, the model still captures which samples have higher or lower levels of a given gene.
Because it’s hard to grok what a spatial correlation of 0.5 means versus a correlation of 0.2, some examples of (sample x gene) pairs at different levels of spatial correlation are shown below.
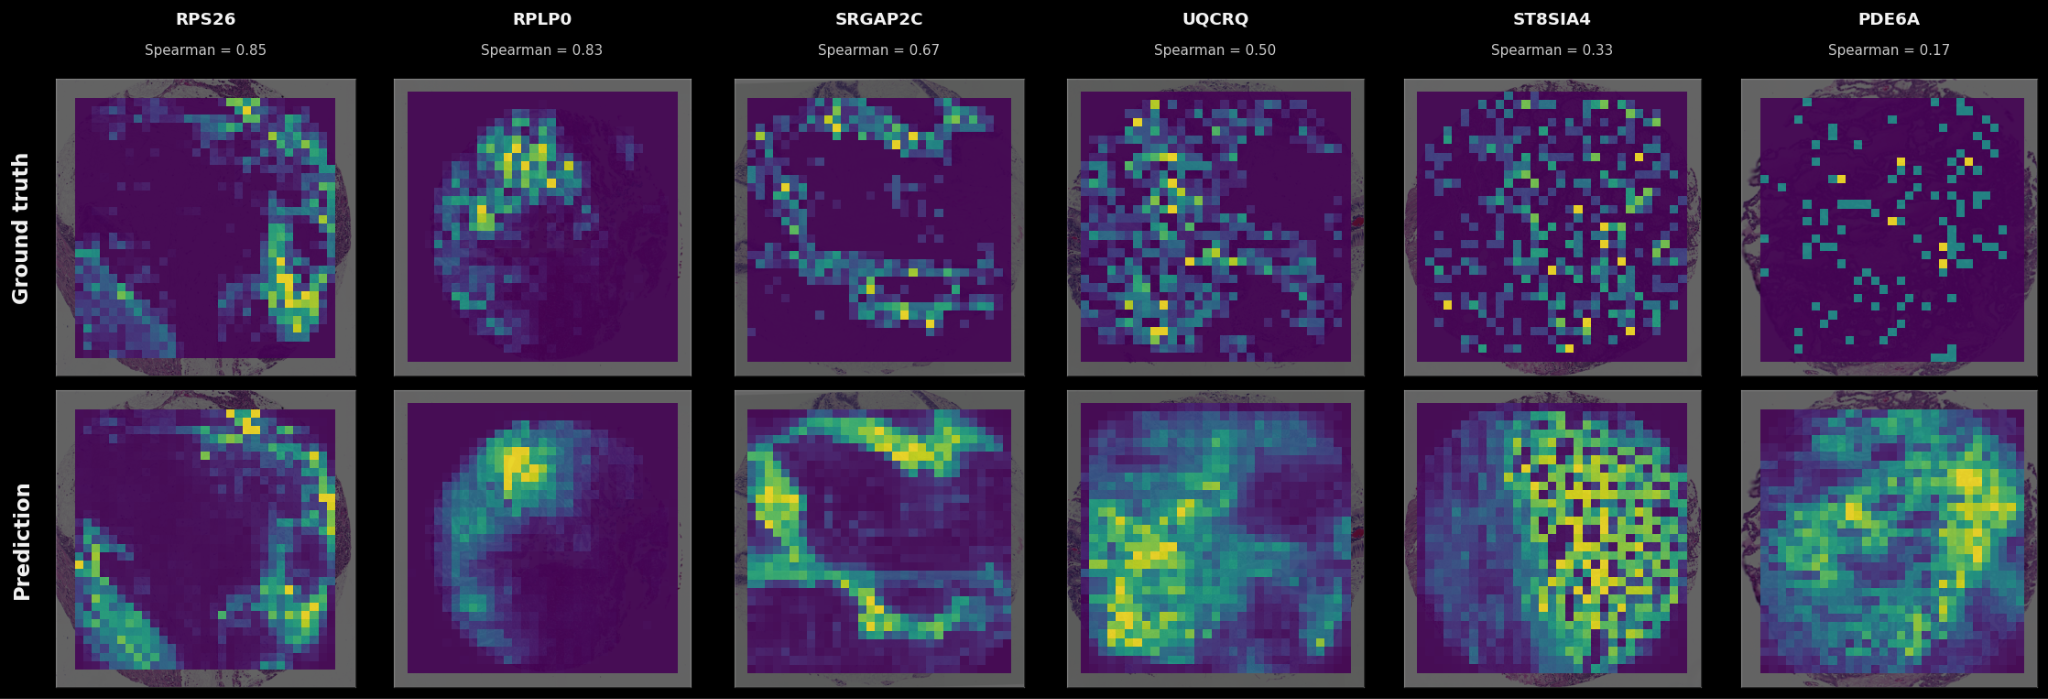
In the cases where a firmly delineated spatial pattern exists in the data, TARIO-2 can recover it, often achieving correlations far above the averages presented in Figure 2. As the transcriptomic pattern grows sparser or more diffuse—the pattern that most genes have—TARIO-2 predictions decline in accuracy, but in those cases the absolute spatial pattern matters less than the bulk values.
This said: it’s worth pointing out that even predictions that correlate only weakly with ground truth can be biologically meaningful. For example, the rightmost prediction in Fig 3 has a correlation of 0.17 but is far from random: some spatial patterns in the H&E are at least suggestive of higher or lower gene expression levels, even though the measured expression is sparse and noisy (possibly due to false negatives in the SpT assay itself). So although some genes are much harder to predict than others, they nevertheless provide a meaningful training signal that TARIO-2 can use to infer the overall biology of the tissue.
We’ve attached some comments in the footnotes over comparisons to other models.2
Three ways to improve TARIO-2
The first, most obvious one to improve TARIO-2 is by increasing the amount of pretraining data for the model. Below, we compare a TARIO-2 trained on 93 patients to a TARIO-2 trained on 2,545 patients (the full dataset). Training on the full dataset quantitatively improves the prediction accuracy on 18947 of the 18964 genes in the SpT panel. Qualitative results are even starker, as predicted spatial patterns for many genes and tumors only resemble the ground truth when TARIO-2 is trained on the full dataset. And while 93 patients may seem like an extremely small amount of data, this is actually much larger than all public, cellular-resolution spatial transcriptomics datasets.
Our ability to generate aligned, diverse, multimodal data at scale is thus a critical driver of model performance. Concretely, we are generating hundreds of patients’ worth of training data per month and are set to accelerate.
Second, we’ve observed that larger versions of TARIO-2 generalize better to held-out patients than the base model shown here. Since TARIO-2 is in the same architectural family as TARIO-1, we anticipate that further scaling model parameters and context length (which is proportional to the amount of tissue the models see at once) will continue to improve performance. A model that can see both a tumor and a distantly brewing immune response in the same field of view should, in principle, be able to make more accurate predictions than one that only sees small glimpses of tissue.
It is worth emphasizing that the TARIO-2 presented here is a 200M-parameter model, which is at the lower end of the tested TARIO size range. Our earlier work established that performance continues to scale out to 4B parameters, and that larger models better exploit increasingly complex inputs. The results shown here should therefore be read as a floor on performance.
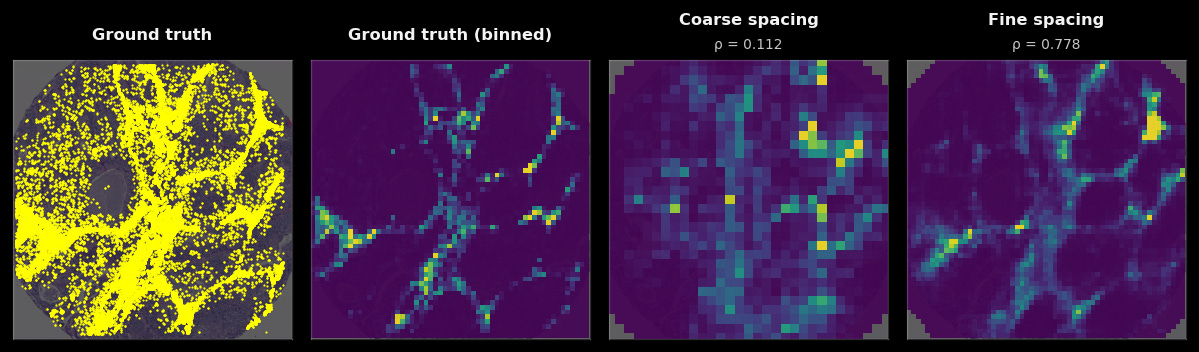
The third, most interesting avenue of improvement is modulating the resolution and complexity of the tissue predictions themselves. In fact, we consistently find that inference at fine-grained resolutions (18 µm) results in predictions that are quantitatively better than coarse-inference resolutions (35 µm) for nearly all genes. Higher-resolution predictions can occasionally produce dramatic jumps in performance as well. Observe below, where the fine-grained gene prediction (18 µm) has a fundamentally different (and far more accurate!) spatial pattern than the coarse one (35 µm).
What is the limit? Given that the spatial transcriptomics data we train on has sub-micrometer resolution, we could conceivably increase the prediction resolutions to predict single-cell and even non-uniform subcellular distributions of gene expression. This comes with a steep computational cost, though: higher-resolution modeling and inference means more tokens and larger models to take advantage of this longer context. Once again: the results here are a lower bound on TARIO-2’s actual capability, limited mainly by the number of GPUs used for training and inference.
TARIO-2 encodes holistic patient biology
We find that TARIO-2’s H&E-based predictions capture not only local spatial gene expression patterns, but also their relationship to the overall biology of the patient. In other words, the totality of spatial gene expression patterns—which is well-inferred by TARIO-2 given a patient’s H&E—correlates with other important, patient-level cancer biology.
For instance, we find that a tSNE constructed from TARIO-2 gene predictions is well-organized by both cancer type (e.g. lung, breast, ovarian) and histologic diagnosis (e.g. adenocarcinoma, squamous cell carcinoma, serous carcinoma). This is easily visible via unsupervised clustering of these embeddings and quantifiable via standard methods like linear decoding.
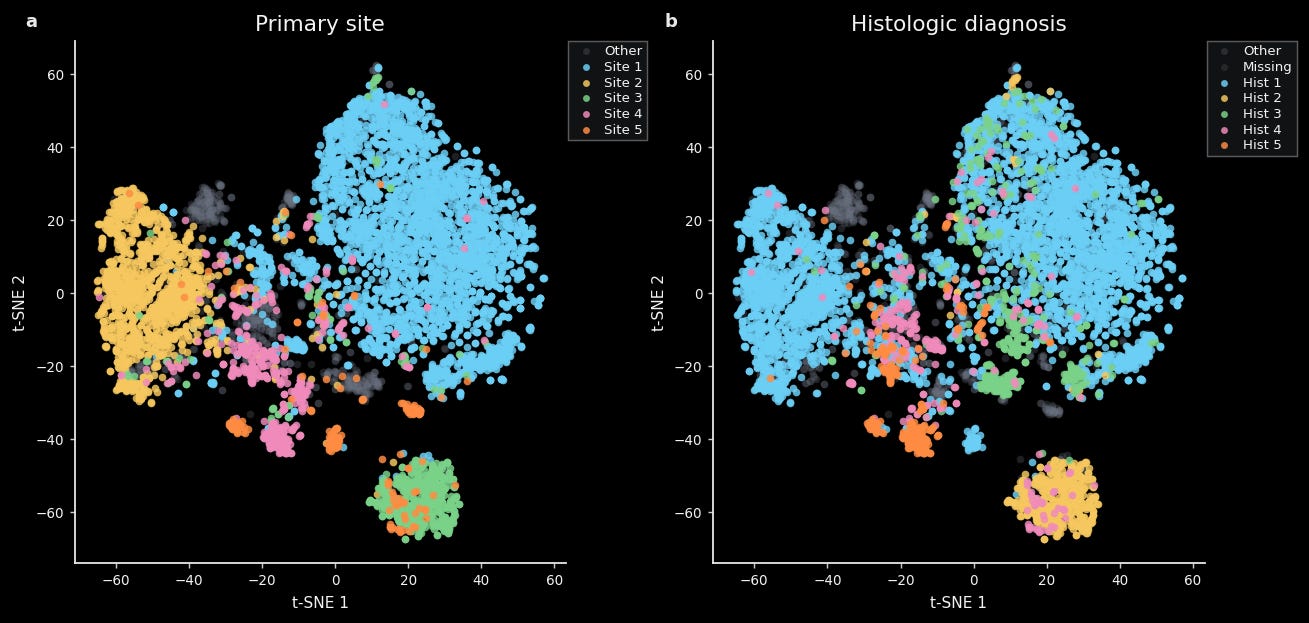
This is not too surprising, given that trained pathologists can easily tell one cancer type from another.
More notable is that TARIO-2 embeddings are predictive of tumor genotype, which strongly correlates with disease biology and treatment effectiveness but is not easily detected by even the highly trained human eye.
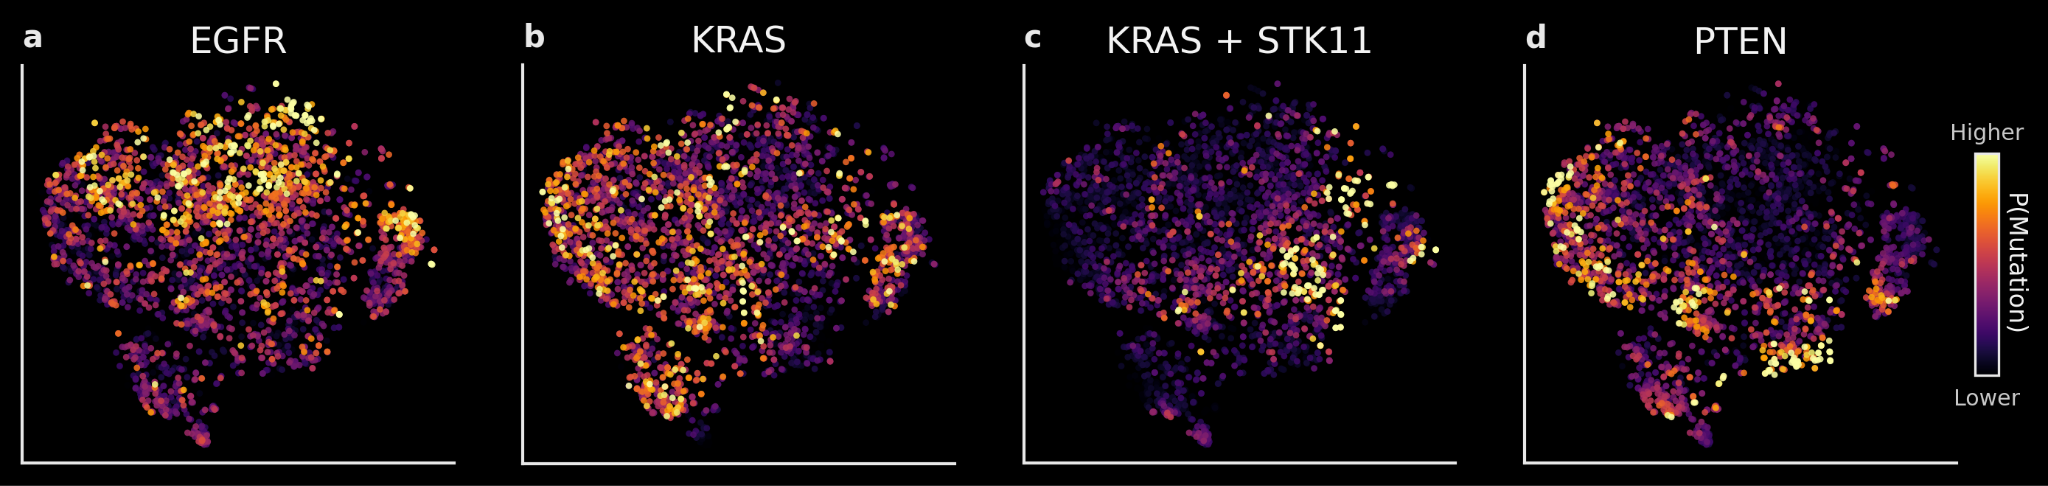
As an example: we trained linear decoders on TARIO-2 embeddings to predict whether a given NSCLC patient has a tumor mutation in the EGFR, KRAS, STK11, or PTEN genes. These predictions are accurate on held-out patients (AUROC of 0.65-0.75). At the population level (shown below), the differences between predictions also accurately reflect known biology: EGFR, KRAS, and PTEN mutations rarely co-occur, and patients with mutations in both the KRAS and STK11 genes occupy a distinct region of the embedding space compared to those with only a KRAS mutation.
Finally, because TARIO-2 embeddings capture patient-level biology from any H&E—including patient biopsies from clinical trials—they can be directly used to predict patient response to treatment. This is an immensely valuable use case, because predicting which patients respond to a drug means designing more efficient clinical trials with higher probability of success. We’re excited to soon share work that includes a real-world example of using TARIO-2 in exactly this way, now accepted to an upcoming oncology conference.
Can TARIO-2 be better than ‘ground-truth’?
One thing we suspect across many of the models we train at Noetik, including both TARIO-1 and TARIO-2, is that their predictions may actually expose latent biology better than the raw measurements they were trained on. SpT assays in particular, despite their miraculous improvements over the past few years, are well known to produce many false negatives (i.e., failure to detect gene transcripts.) Thus what we really want is not a model that perfectly reconstructs noisy raw data, but one that “denoises” the measurements to encode the underlying biology of the data-generating process – which parts of the tissue are expressing how much of each gene.
A good illustration of this “denoising” behavior is a 2018 computer vision paper titled ‘Noise2Noise: Learning Image Restoration without Clean Data’. The setup is simple: take a corrupted image as input, take a differently corrupted version of the same image as the target, and train a model to map one to the other. What the authors found is that a model trained across many such noisy pairs will converge not on any single noisy observation but on their average; which, if the noise is unbiased, is the clean image.
Here is a useful graphic from the paper to understand what’s going on:
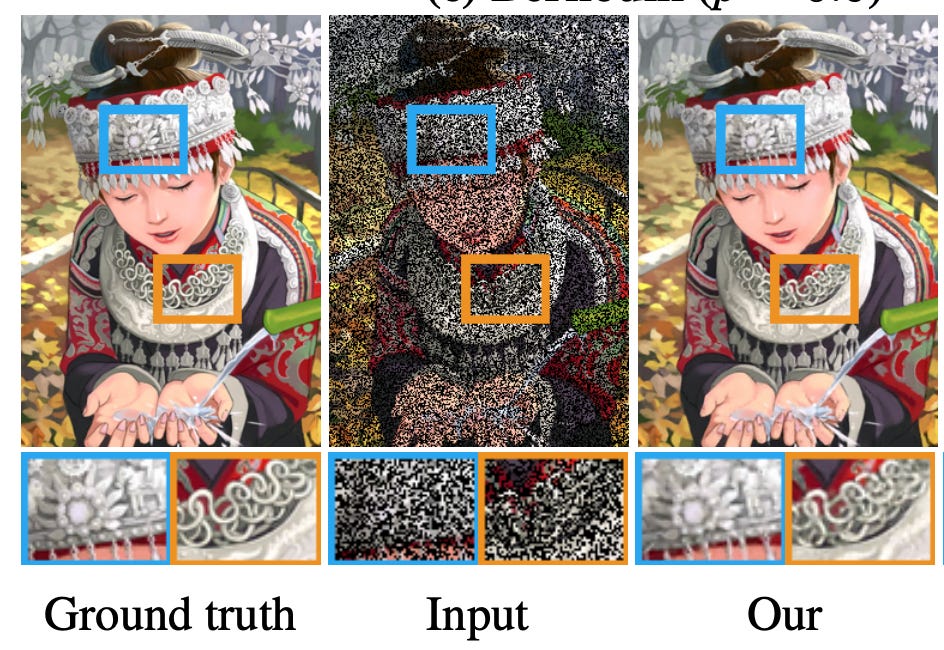
We bring this up because we think TARIO-2 is doing something similar. Although we can’t generate multiple (noisy) observations of SpT data from the same tissue sample, TARIO-2 is well-poised to learn from morphological redundancy across samples. The model does not see the same tissue twice, but it sees similar tissue thousands of times. One reason we think TARIO-2’s predictions may be closer to the true underlying biology than the raw SpT data is that, especially for sparsely detected genes, the model outputs are noticeably smoother than the punctate transcript detections and often track human-visible patterns in the H&E inputs.
Right now these observations are mainly food for thought. However, they could be pointing toward a broader theme for foundation models in the life sciences—most of which are trained on noisy snapshots of an underlying biological system, with data quality limited by current technology. Just the other week, Meta released TRIBE v2, a foundation model that can simulate fMRI’s in response to sight, sound and language. In their blog post, they wrote:
Surprisingly, TRIBE v2’s predictions are often more representative of the typical response than an actual fMRI scan. While raw recordings are inherently noisy – distorted by heartbeats, movement and device artifacts – TRIBE v2 predicts a canonical brain response, which is actually more correlated with the group’s average neural activity than almost any single fMRI recording.
All of this implies we should not think of foundation models like TARIO-2 as mere replacements for expensive assays. Rather, they are systems that learn, by seeing far more examples than a human ever will and by discovering patterns invisible to us, the underlying biology that evades any single assay run on a single sample.
Conclusion
Earlier this year, Elliot Hershberg profiled Sid Sijbrandij—the founder of GitLab—and his effort to treat his own osteosarcoma after exhausting the standard of care. Sid’s approach involved running every available assay as frequently as possible and maintaining a massive, structured repository of the results: single-cell RNA sequencing, bulk RNA-seq, high-resolution microscopy, immune profiling, and more. Based on this information, his team developed over ten personalized therapies and, almost certainly thanks to these efforts, his cancer is currently in remission.
It is an extraordinary story. It is also, as several commentators noted, a story about a singular billionaire.
This said, it is important to specify that the “singular” part meant the “billionaire” part was necessary. Sid’s wealth could immediately buy the answer to many expensive questions about his tumor: which immune populations are at the margins, what proteins are most abundant, and so on. But what could not be bought outright was the context to interpret those answers. Is this expression pattern unusual? Does this immune infiltration profile resemble the patients who responded to that combination therapy, or the ones who didn’t? What was likely far more expensive than the tumor profiling was that the team needed to actually grasp what this data meant, manually assembling that reference frame, synthesizing incomplete literature and clinical intuition, all for a sample size of one.
TARIO-2 will help build that reference frame at scale, allowing us to represent all patients in the same interpretable biology space. When an H&E is run through the model, the output is nominally a spatial transcriptome, yes, but it is a coordinate in this space, allowing clinicians and researchers to ask the sort of comparative questions that Sid’s team answered by hand, for one person, over many months. TARIO-2 generates the substrate for answering them in minutes.
Of course, models like these do not replace the assay. SpT remains the richest single measurement of a tumor we have access to, and for patients where it could be extracted, we generate that alongside H&E. But for the overwhelming majority of cancer patients for whom SpT can never be generated, because of cost, logistics, or otherwise, TARIO-2 will allow for their biology to be understood and contextualized in a way that was previously impossible.
And though contextual understanding is valuable, what is even more valuable is the potential for that understanding to be acted on by machine intelligence directly. As we mentioned earlier, an upcoming article will discuss research accepted to a major conference, in which we show how TARIO-2 distinguishes non-responders from responders based on pre-treatment H&E alone in a clinical trial setting. We look forward to sharing more detail about this case, which is for us the strongest demonstration of how foundation models can directly impact clinical decision-making and benefit patients.
If you are interested in partnering on the models discussed here, please reach out to partnerships@noetik.ai.
This article would not be possible without significant contributions from Eshed Margalit, Daniel Bear, Lacey Padron, Dexter Antonio, Michela Meister, Ron Alfa, Dan Millman, and Dulce Ovando Morales.
While we won’t dive into the technical details of TARIO-2 here, we can say that TARIO-2 is an autoregressive model trained to “predict the next token” in the style of LLMs. This is important because we have found that these models improve when shown longer sequences of tokens, and the inputs to TARIO-2—high-resolution H&E images and micron-scale detections of transcripts for 18,000 genes—comprise a lot of tokens.
SpT is still a nascent technology and there are major differences between the different platforms on which researchers are now generating data; detection method, spatial resolution, sensitivity and specificity, etc. TARIO and TARIO-2 are, as far as we know, the only models trained on anywhere near this scale of CosMx data (>100M cells across >2500 patients). So although we are encouraged by the current model’s accuracy at predicting high-resolution spatial gene expression patterns in held-out patients, there is still plenty to learn about the relative contributions of H&E training data, paired SpT data, SpT platform, model architecture, training loss function, and other factors, and how they compare to others. This is a major focus of ongoing work.
Very interesting, thanks for sharing! I wonder if there is any metric that we can quantify when you mention the example from Noise2Noise: ' if the noise is unbiased, is the clean image.'. It can indeed be related to innefective capture, transcript diffusion from specific regions to neighbors, etc, but I wonder if other aspects like sample processing can cause biased patterns in the SpT?