

Scaling behavior of TARIO
Observations from building world models of biology

tl;dr: We have trained a new self-supervised model across thousands of human cancer spatial transcriptomes, nicknaming it TARIO. We have found that the model exhibits scaling behavior across three axes. We have not yet discovered a ceiling to further scaling, and plan to dramatically expand both our compute and data generation capabilities in the coming year. We are always looking for ML, engineering, and wet-lab talent to push this further. Please reach out to me directly at abhishaike.mahajan@noetik.ai to chat!
Introduction
Last year, we trained a foundation model on one of the largest sets of spatial transcriptomics data in existence, called OCTO-VC. A few months back, we put together a few essays (1, 2, 3) on how we’ve used this model to tackle clinical-stage problems that were previously intractable, with the hopes that it would be interesting for oncologists, immunologists, and clinicians to read through.
Separately, we have been exploring fundamentally different approaches to modeling spatial biology; new architectures, new loss functions, and new tokenization schemes that depart from the design choices underlying our earlier work. The result is a new model, built from the ground up, that we refer to as TARIO1.
Now, TARIO is particularly interesting in that it is a fair bit more amenable to scaling than anything we’d developed before. And after we noticed the relative ease with which more compute could be thrown at the model, a lot of questions were raised internally. Do we see any benefits to doing so? What axes can be scaled? Do we see ‘emergence’? In the end, we decided it would be a good use of our time to run the very expensive experiments necessary to answer these. This article is the end result, compiling together observations from dozens of training runs.
We hope this is interesting! But, more importantly, we are writing this essay because we are always searching for computational research, engineering, and wet-lab talent who want to push this sort of work even further. We are generating one of the largest spatial cancer datasets in the world (all collected from human tumor samples), are working on types of ML research that is conclusively pre-paradigmatic, and plan to dramatically ramp up our training scale in the coming months by an order of magnitude. We’re open to remote candidates, but also have a beautiful office in South San Francisco. And we are especially excited about working with people who have never touched biology at all! If you’ve worked on any modeling problems in vision, text, robotics, or otherwise, we’d still love to chat with you to convince you that cancer is worth spending some years working on.
If any of this seems up your alley, please reach out to me directly at abhishaike.mahajan@noetik.ai to discuss further.
Scaling behavior
First, some background information. We unfortunately cannot share too many details on how TARIO actually works, other than that it is a generative transformer, trained entirely on 1000-plex spatial transcriptomics data collected from thousands of human tumor resections.
What we can say is that there are three primary dimensions that TARIO can be scaled upon.
One, the obvious one, simply increasing the parameter count of the model.
Two, also an obvious one, increasing the number and diversity of input transcript tokens.
Three, more interesting, increasing the context length of the model. In the ideal setting, TARIO could ingest the totality of data-points extracted from a tumor sample, but, unfortunately, this is roughly 10 million tokens worth of data. So in practice, TARIO is trained on smaller, local neighborhoods of cells, but we can expand this spatial context (in either training or inference) to observe how this improves model predictions. For clarification, we’ll refer to scaling here in terms of ‘transcripts’, e.g., a context length of 10 means that TARIO will use up to 10 nearby gene transcripts from its immediate spatial neighborhood (around ~100 um squared) to make its prediction for any given cell in a tumor sample.
One last question: how do we judge performance improvements? For the purposes of this post, we’ll primarily use validation loss, which for TARIO is analogous to the “next token prediction” loss used in evaluating LLMs on text data. This means we are judging the models’ ability to reconstruct true spatial gene expression patterns. We recognize that these metrics are ultimately a proxy for what ultimately matters, which is predicting patient response to drugs, and we’ll discuss that a bit more in the conclusion.
With that background, here are the results:
Parameter + context length scaling
We tested five model sizes (20M, 100M, 500M, 2B, and 4B parameters) and four context lengths (2048, 4096, 8192, and 16384 transcripts). Here is a figure of % improvement in validation loss across the genes that are measured in our spatial transcriptomics assay as scaling occurs.
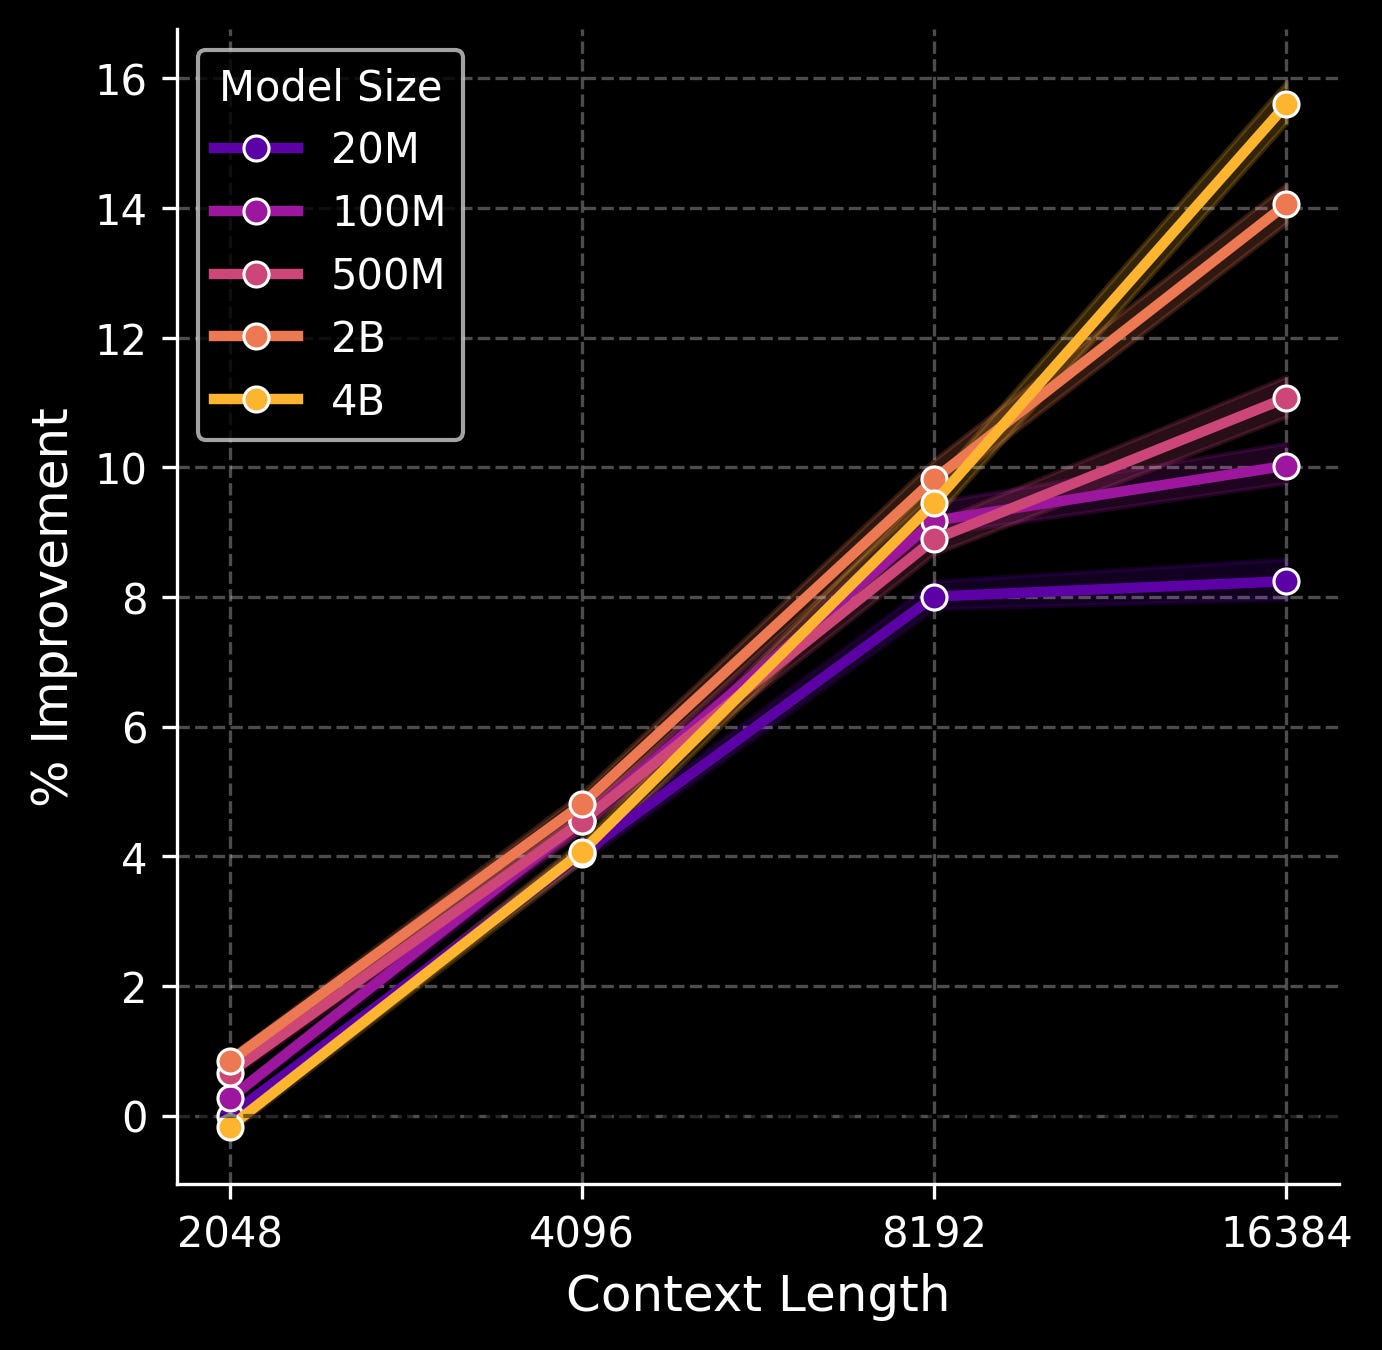
The sweet spot, interestingly, is when both parameter count and context length—which again, corresponds to the number of gene transcripts the model sees in a local neighborhood of tissue—are scaled in tandem. A smaller model doesn’t benefit much from a very large context window, likely because the model simply doesn’t have the capacity to make use of all that information. And a larger model with a very small context window is mostly a waste of compute, since most of the parameters simply aren’t put to work. Here, the 4B model shows no signs of plateauing, even with the largest context size. This is as opposed to the smallest 20M model, which stops benefitting from increased context when moving from 8192 to 16384 transcripts, and even the 100M/500M models start to level out.
What are these models actually using these longer contexts for? We suspect the answer is what you’d suspect: integrating in the information from hundreds of spatially nearby cells to construct semantically meaningful structures.
For example, consider the following image of TARIO predictions at different context lengths. At the largest window, a semicircle of immune-infiltrated tumor at the bottom (pink) and a tertiary lymphoid structure (green) at the top pop out, both of which are confirmed to exist via pathologist analysis of this patient’s histology. At the shortest context, the structures are only weakly inferred, and less separated.
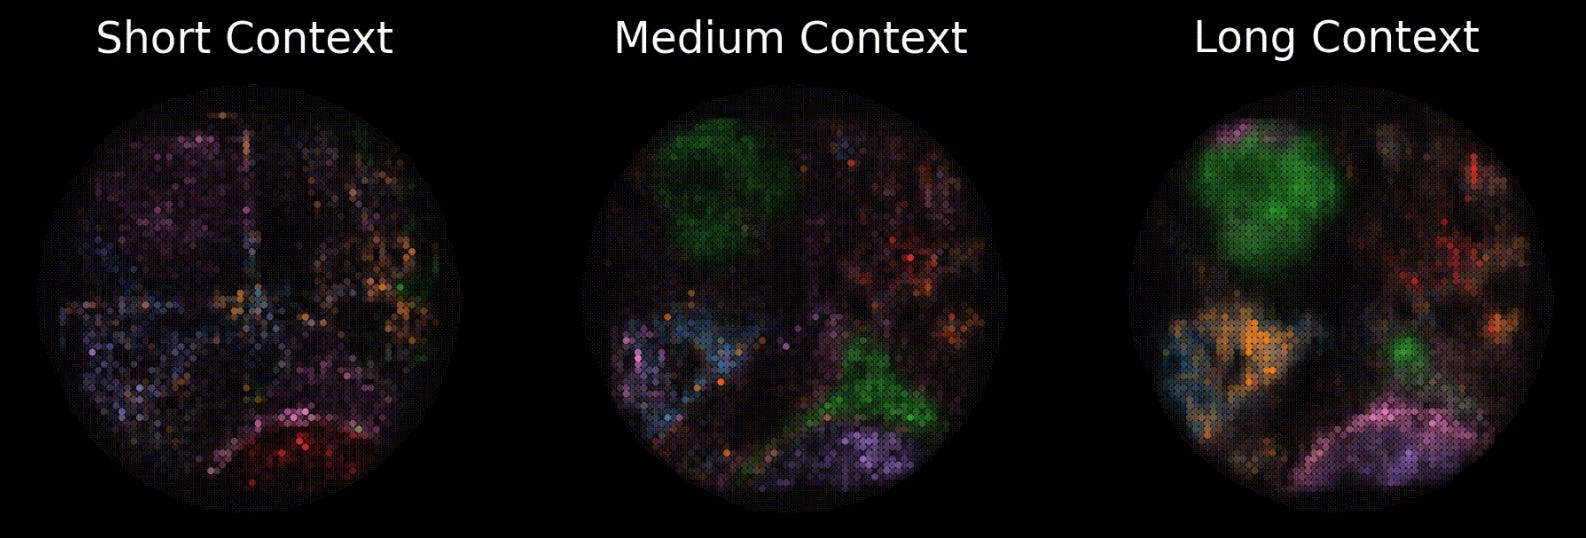
In other words, at the largest scales, the model is learning something real about how tumors spatially organize themselves, not merely overfitting to local transcript noise. It is extremely likely that other clinically meaningful, but non-human-legible structures, are surfacing in these representations too.
How can we scale further from here on out? While we can train an even larger model in parameter count, the plot above suggests that we’ll get the most bang for our buck if we scale the context length at the same time. What is the limit there? In the current spatial windows that the model is operating in (100 x 100 um), there are typically 20,000~ transcripts at most. But the spatial windows themselves can also be dramatically expanded; our tumor samples are a hundred times larger than the current spatial context windows, and can contain tens of millions of transcripts in total.
Extending out even further, we are switching to whole spatial transcriptomics (as opposed to the 1000-plex spatial transcriptomics used in this model) which will allow us to extract an extra order of magnitude of information from each slide. In this world, the new upper limit is a context window of 100M transcripts.
And this is all without interleaving in the paired proteomic, pathology, and genomic modalities we extract from a patient’s tumor, which would almost certainly push up the total possible set of input tokens by another order of magnitude.
This is all to say: we do not see a ceiling in sight.
Data scaling
As Jack Morris best put it, There Are No New Ideas in AI… Only New Datasets. The historical arc of machine-learning in literally every field suggests that the single best predictor of progress is not really cleverness, but access to better data. Common Crawl begat GPT, the PDB begat AlphaFold, and so on. We strongly believe spatial transcriptomics, derived from actual human tumors, is going to be one of those datasets for cancer.
As a quick aside: this is part of why we’re skeptical of purely computational efforts in this space. If you don’t control your own data generation pipeline, you’re ultimately bottlenecked by whatever public datasets exist, and public biological datasets here are, almost universally, too small, too noisy, and too narrowly curated to support the type of scaling that models most benefit from! It’s a pain to collect your own data, but this section of the essay could not exist without that pain!
So: how does TARIO scale with data?
Well, there’s an interesting story to sketch out here. Let’s start with something basic, and train a 100M + 4096 transcript context TARIO model (chosen because it’s a decent model and cheap to train) on increasing fractions of our two largest cancer subtypes: LUAD and CRC (lung adenocarcinoma and colorectal cancer), and observe how well it does on gene-level predictions across those two cancer subtypes and PDAC (pancreatic cancer), which is an ‘unseen’ cancer subtype.
For reference, everything is represented at a % improvement over the loss given by the ‘3% of (LUAD + CRC)’ model, so higher is better.
Okay, neat! We see that LUAD and CRC clearly benefit from more of its subtype being added to the training set, with the improvement leveling off from 40% to 100%. This benefits PDAC as well—indicating some level of generalization to held-out cancer types—but the improvement is weaker. If we ultimately hope to create a model that is ‘pan-cancer’, aggressively gathering more data points only from singular indications does not seem like the way to go.
To help explore this further, we trained multiple models on combinations of our data: LUAD, CRC, PDAC, and also ‘everything’, which includes a few, less common cancer subtypes, including ovarian, breast, and others. Once again, we will present results in comparison to a baseline, which, in this case, is the ‘100% LUAD + CRC’ model. Again, higher is better.
Lots of numbers here! Let’s walk through the primary results.
The first takeaway is that new indications are worth collecting because they help that specific indication. You can observe this from the ‘100% of (LUAD + CRC + PDAC)’ model; the inclusion of PDAC dramatically improved performance on PDAC compared to a model trained on no PDAC at all (100% of (LUAD + CRC)).
The second, more interesting takeaway is that new indications are worth collecting because it helps already-seen indications a little. You can observe this by the fact that there is a bump in LUAD + CRC validation performance as you include PDAC, and another bump when you include ‘everything’. A similar phenomenon is seen for PDAC validation performance, which improves from 3.21 to 3.98 when ‘everything’ is included.
The third takeaway is that specialized models are quite bad at doing anything else beyond what they were trained on, and are beaten by a fully general model. The model trained entirely on PDAC data is quite good at predicting PDAC, but awful at everything else, and was still beat out on PDAC by the ‘100% of everything’ model.
Our fourth and final takeaway, which confirms what we’ve already seen, is that we do not observe especially strong generalization performance when evaluating a model on a cancer subtype it has never seen before. For instance, we observe that the ‘100% everything, but not PDAC’ model is only slightly better on PDAC than a model trained only on LUAD + CRC, despite the former model having seen a fairly broad universe of cancer. It may be the case that this disappears at a certain level of data scale, but we suspect that what we are stumbling across here is something that everyone eventually discovers in their application of machine-learning to the life-sciences: biology is very heterogenous, and going out of distribution is easy.
Importantly, we consider this last point a strong affirmation that building our data collection infrastructure was the right call. If generalization across cancer subtypes were easy, as in, if training on LUAD and CRC magically transferred to PDAC, then there would be much less value in controlling your own sample pipeline. But it doesn’t! The only reliable way to get good performance on a cancer subtype is to have actually trained on that cancer subtype, which means the bottleneck is, and will continue to be, access to high-quality tumor samples across the full diversity of human cancers.
The practical takeaway is clear: we should be collecting as many different cancer types as possible, even if we can only get small numbers of samples from each. A hundred samples across ten rare cancer types are almost certainly more valuable than a thousand additional samples of NSCLC. This is not how most data collection efforts in this space have historically worked, but our-data-driven conclusion is that it’s critical to embrace this “bitter lesson” for scaling foundation models of patient biology.
Conclusion
Parameter, data, and context scaling all work, and none of them seem to be plateauing.
Yet, despite how exciting all these results may be, one may be left with a rather important question: how much does this all matter? Ultimately, the goal of these models—and scaling them—is not to predict spatial gene expression, but to create a representation space of biology that is rich enough to do something clinically useful. Nothing else matters, not really.
And the one clinically useful thing that perhaps matters the most is: how well does TARIO predict patient response to cancer drugs? As in, can the model look at a patient's tumor before treatment and tell you whether they're going to respond?
Early results are encouraging. For some clinical datasets, it seems that larger-scale models do produce more accurate patient-level predictions. Unfortunately, the vast majority of our response data is sourced through partnerships with pharmaceutical companies, and we’re not at liberty to share those results just yet. The core challenge here is that TARIO requires spatial transcriptomics data for inference, and generating spatial transcriptomics requires physical tissue. And physical tissue with paired response data is hard to get! Most historical clinical trials do not bank tissue with spatial transcriptomic analysis in mind, and even when they did, the samples have often degraded beyond use. As a result, the substrate necessary to use this model is, to put it bluntly, rare.
But this is not true for H&E slides. Nearly every pathology lab in the world has archived H&E slides going back decades, millions of them, with extremely rich response data to go alongside it.
Because of this, we’re currently training a model to bridge that gap: converting H&E into predicted spatial transcriptomes, which would unlock TARIO-level analysis for essentially any tumor sample that’s ever been sliced and stained. We plan to cover this model in an upcoming post, discussing where we see these types of models being most useful, its own unique scaling behavior, and, most importantly, how well it predicts patient response across hundreds of cases.
Note: much of the heavy lifting behind this work was done by the extremely talented Daniel Bear, Eshed Margalit, Jake Schmidt, and Yubin Xie, amongst others. If you join us, you may get to work with them!
Unlike OCTO-VC, which is trained based on the self-supervised task of "masked autoencoding"—filling in randomly hidden pieces of the training data examples—TARIO is an autoregressive transformer, trained on a spatial transcriptomics-appropriate version of the infamous "next token prediction" task behind GPT, Claude, Gemini, and so on. Also, whereas OCTO-VC is meant to simulate the effects of multimodal patient context on individual virtual cells, the point of TARIO is to model much larger regions of spatial transcriptomics data.
great article..proof that scaling works is pretty cool! why would H&E -> transcriptomics -> survival (double noise) work better than H&E -> survival though..
Hmm this is interesting that TARIO is tokenizing on the transcript level vs tokenizing at the cell level. Is this different than OCTO-VC?